
1. Real-time Monitoring
Map (/map): live vehicle location (from vehicle tracking device — chapter 11). Monitor (/monitor): status dashboard of active trips, progress against schedule and off-schedule alerts. TMS monitoring capabilities enable real-time tracking of your entire fleet, ensuring visibility into every vehicle's status and location.
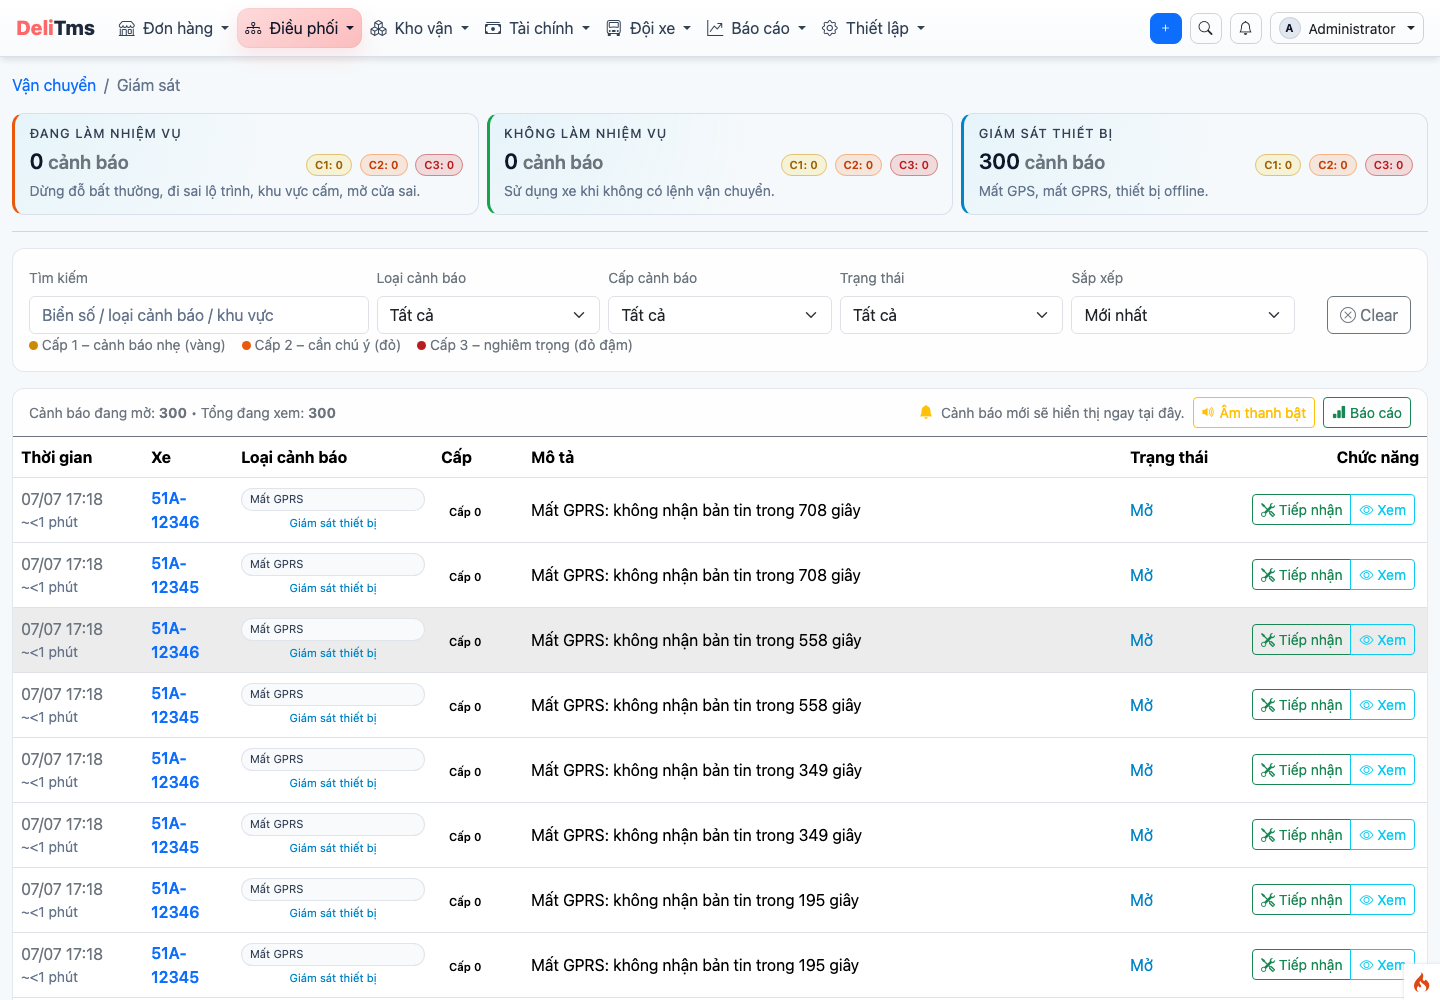
Monitoring — status of active trips and off-schedule alerts.
2. Operational Reports
Transportation Report (/report) is the overview page: daily trip volume, completion rate, packages — volume, top active vehicles and Export CSV by date button. From here dive deeper into specialized reports:
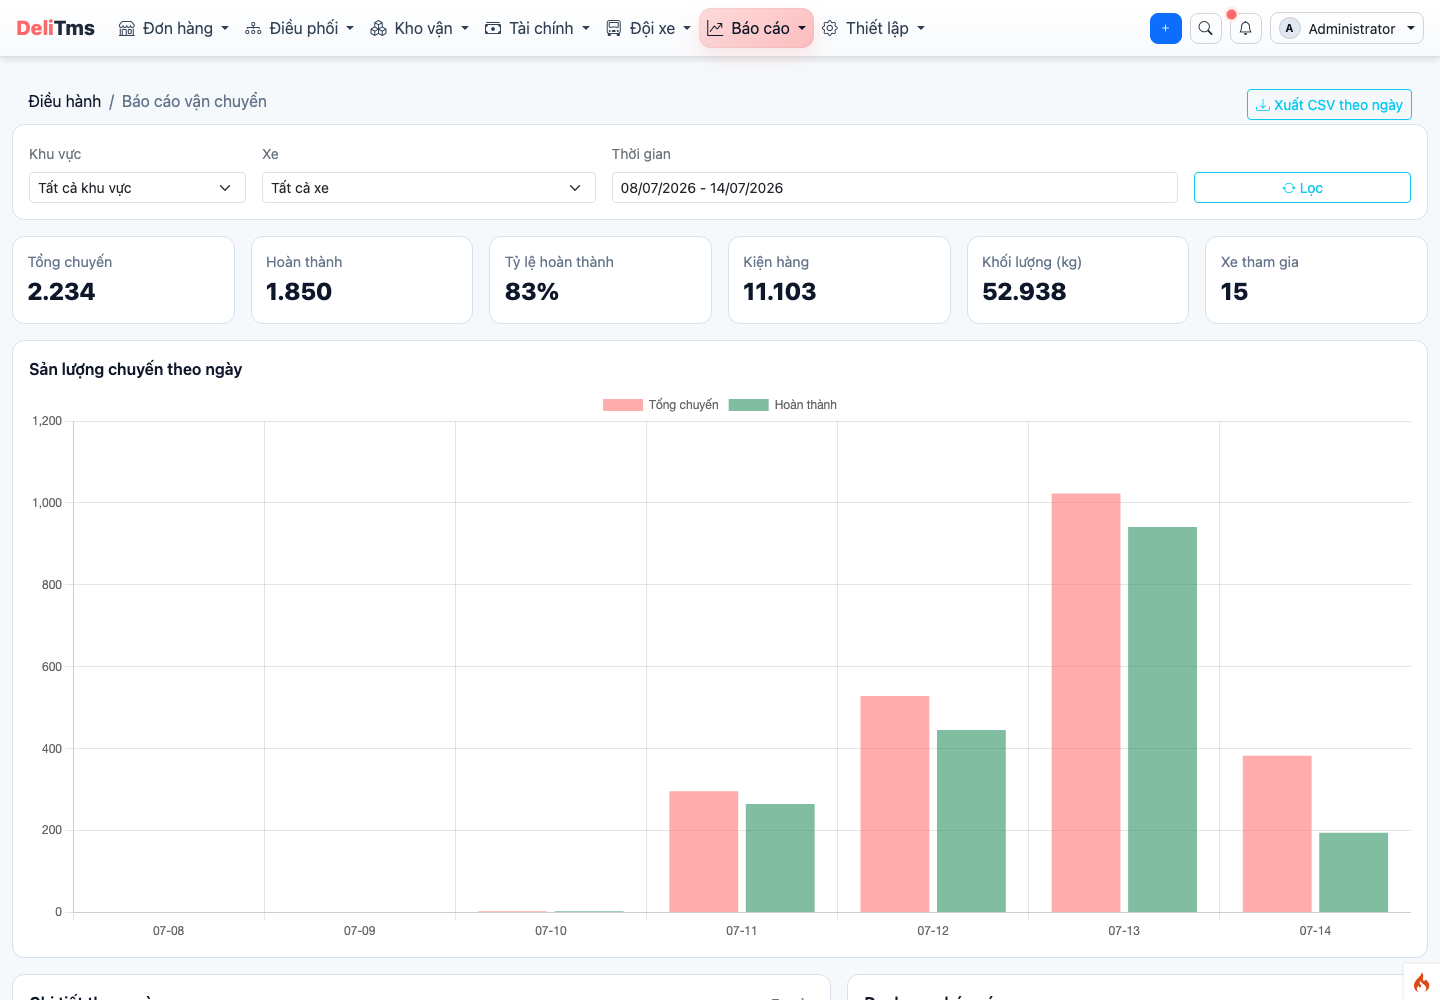
Transportation Report — overview of volume, completion rate and top vehicles by period.
| Report | Path | Answers the question |
|---|---|---|
| System Activity | /report/activity | How the entire network operates: trips by day/peak hour, density by post office, trip status, top vehicles |
| Route & Geo | /report/route-geo | Declared route network on map, cargo flow between post offices, post office with most departing trips |
| Anomaly Alerts | /report/anomaly | Operational anomalies requiring attention (route deviation, long stops...), acknowledgment rate and handling time |
| Driving Behavior Analysis | /report/driving | Departure discipline: on-time departure rate, average delay by day |
Detailed driving behavior metrics (speeding, harsh braking, sharp cornering) require tracking device with sensors — this section auto-activates when enterprise connects device (chapter 11).
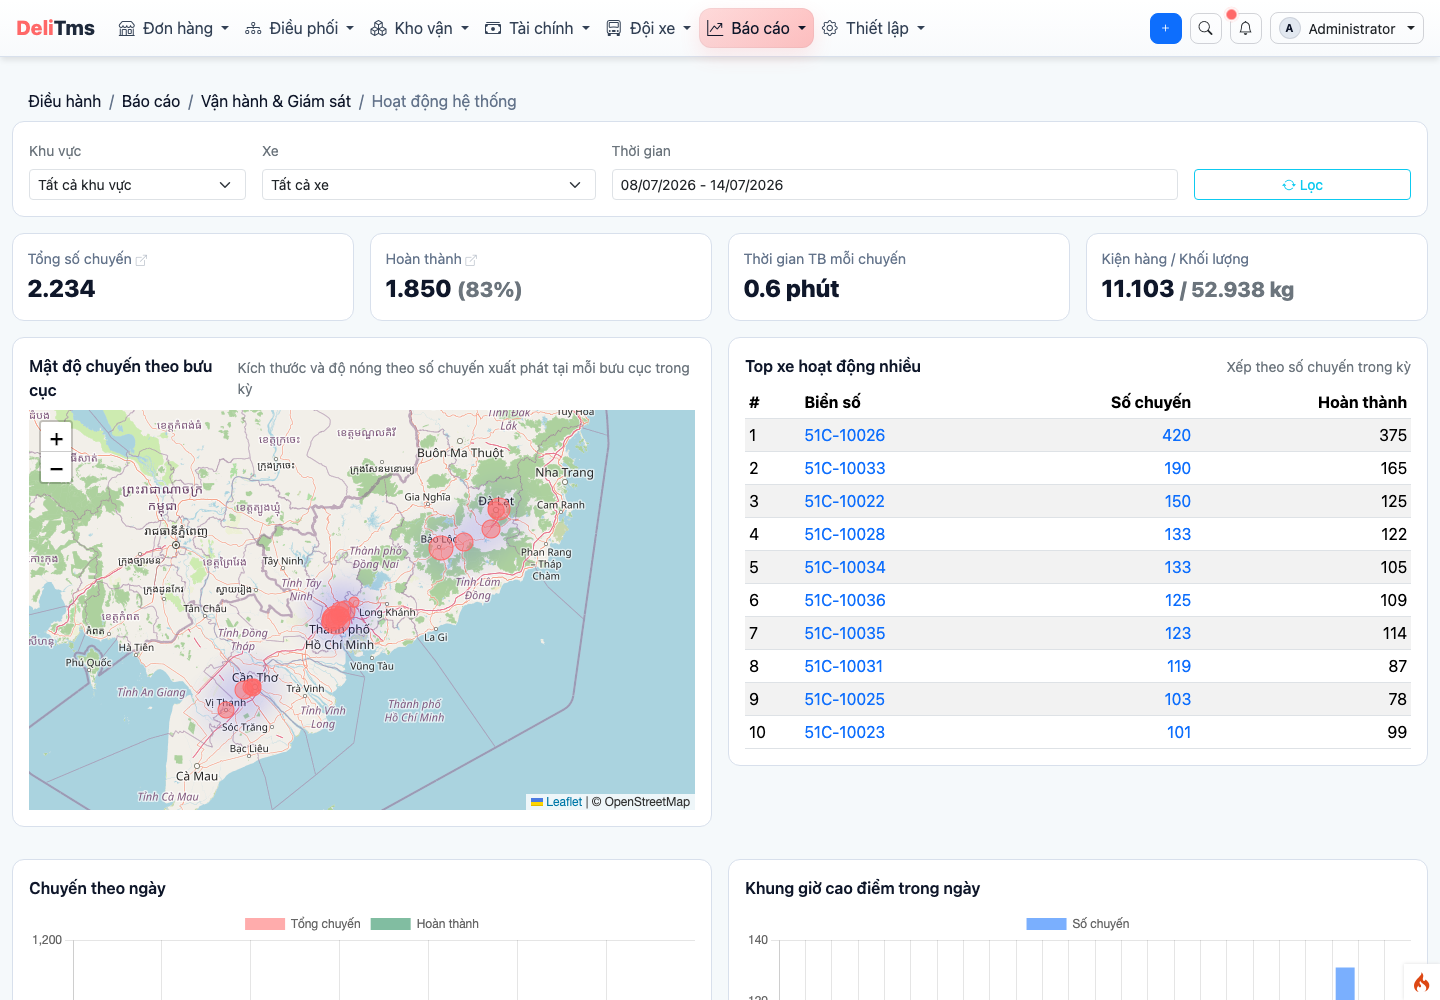
System Activity — trips by day, peak hours and density by post office.
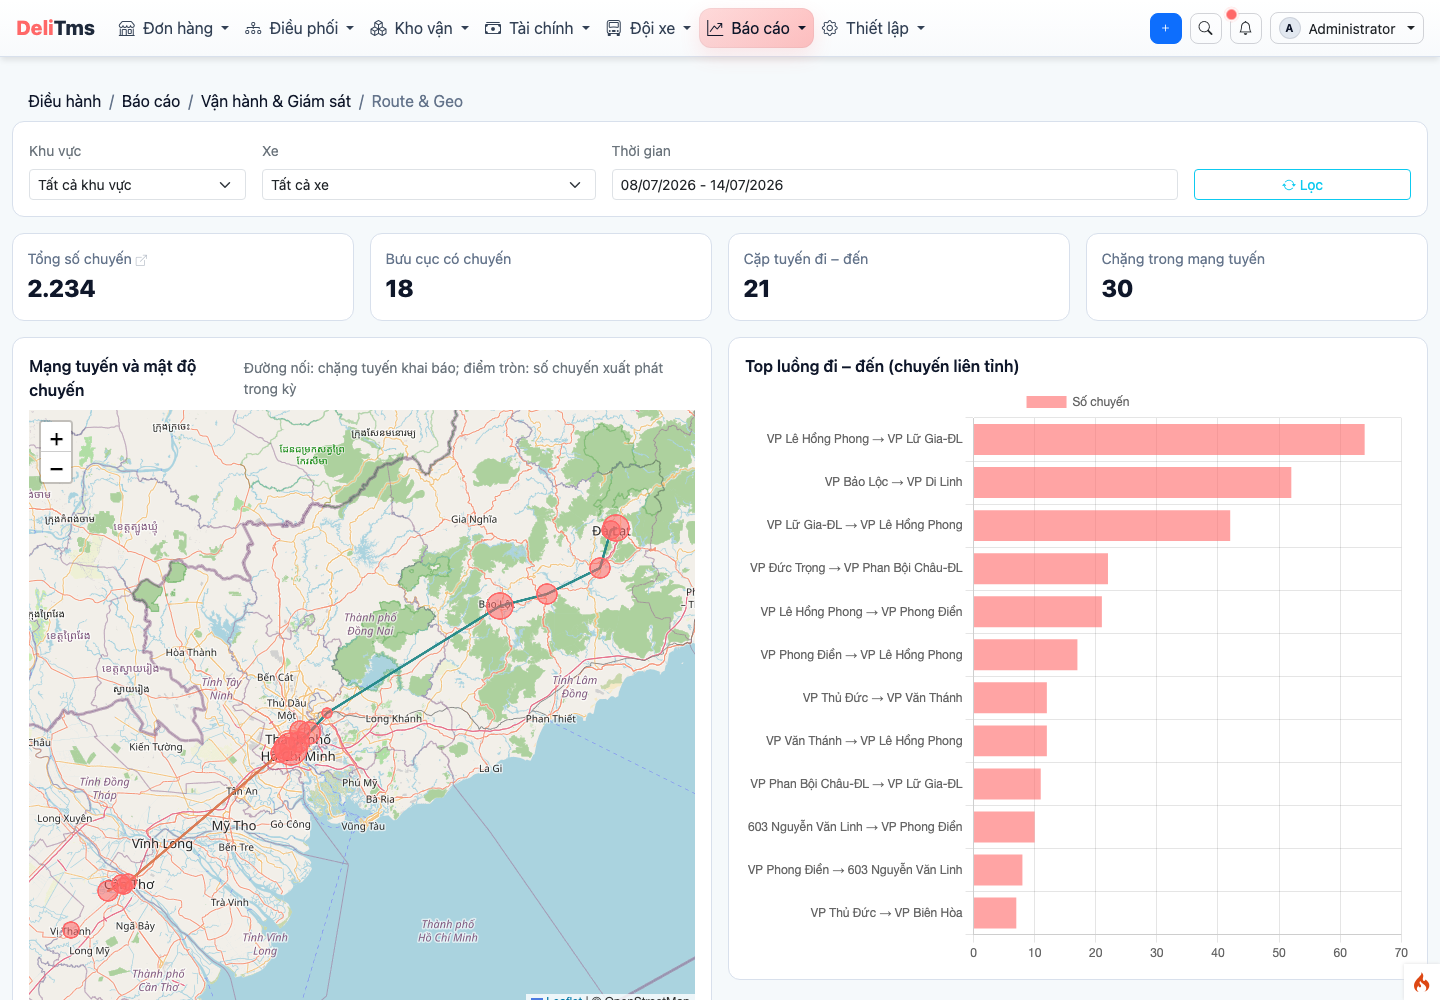
Route & Geo — route network on map and top cargo flow directions, providing comprehensive route network reporting.
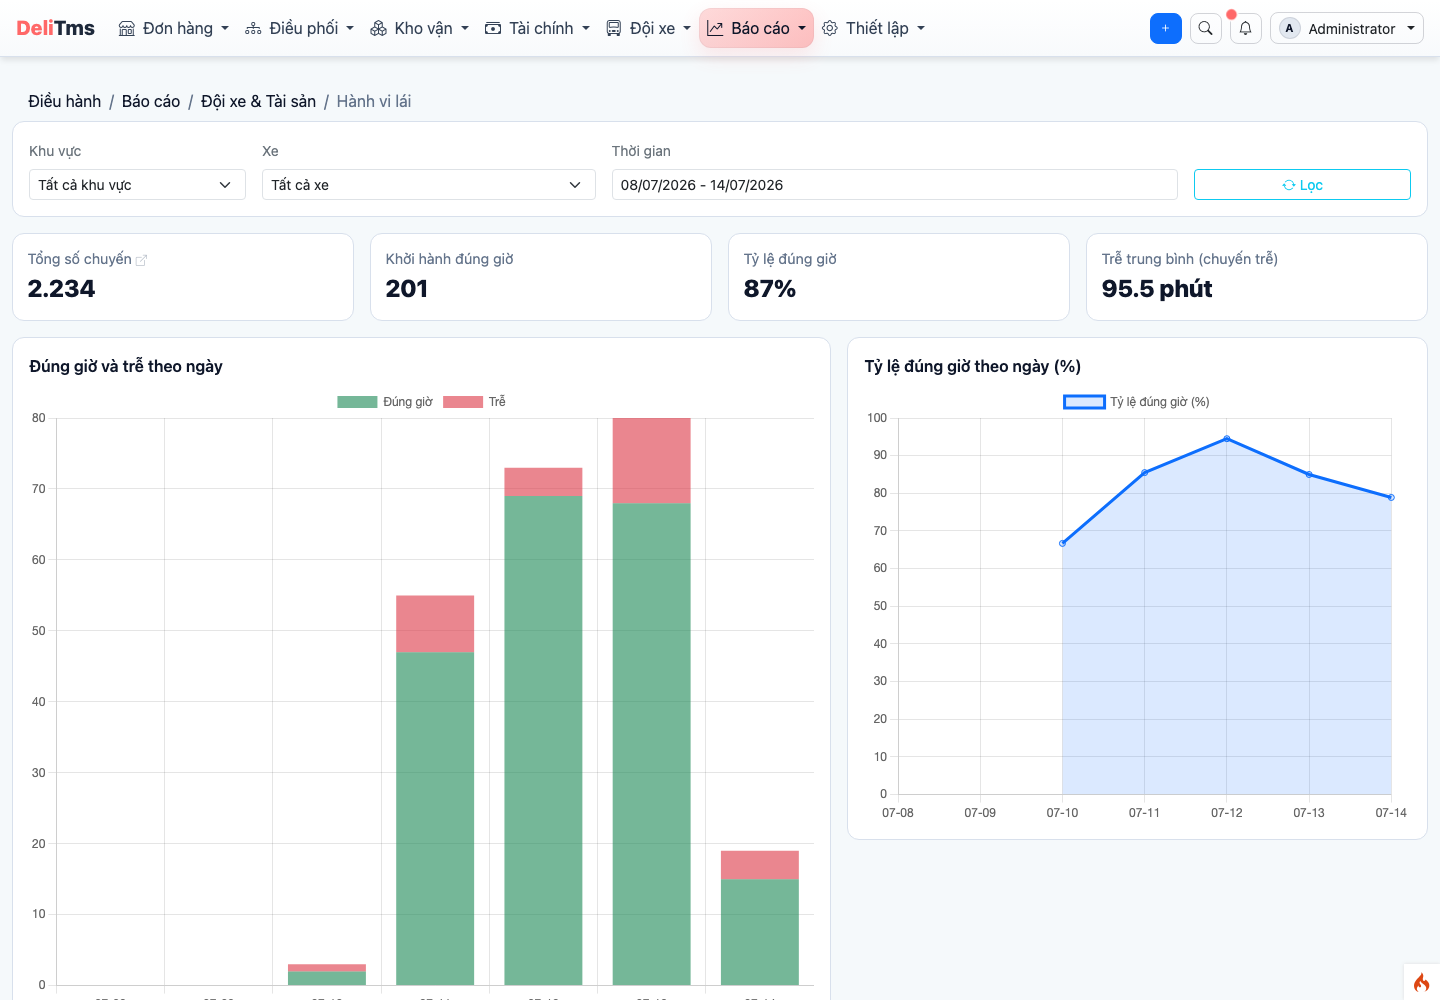
Driving Behavior Analysis — on-time departure discipline by day.
3. Fleet Cost Reports
| Report | Path | Content |
|---|---|---|
| Vehicle Report | /fleet/report | Utilization summary per vehicle |
| Fuel Consumption | /fleet/report/fuel-consumption | Liters/100km by vehicle, compare against quota, detect anomalies |
| Repair & Maintenance Cost | /fleet/report/maintenance-cost | Cost by vehicle/category/period |
| Other Costs | /fleet/report/cost | Tolls, parking... by vehicle/period |
| Transportation Cost Analysis | /fleet/report/cost-analysis | Total cost per vehicle / per km — evaluate utilization efficiency |
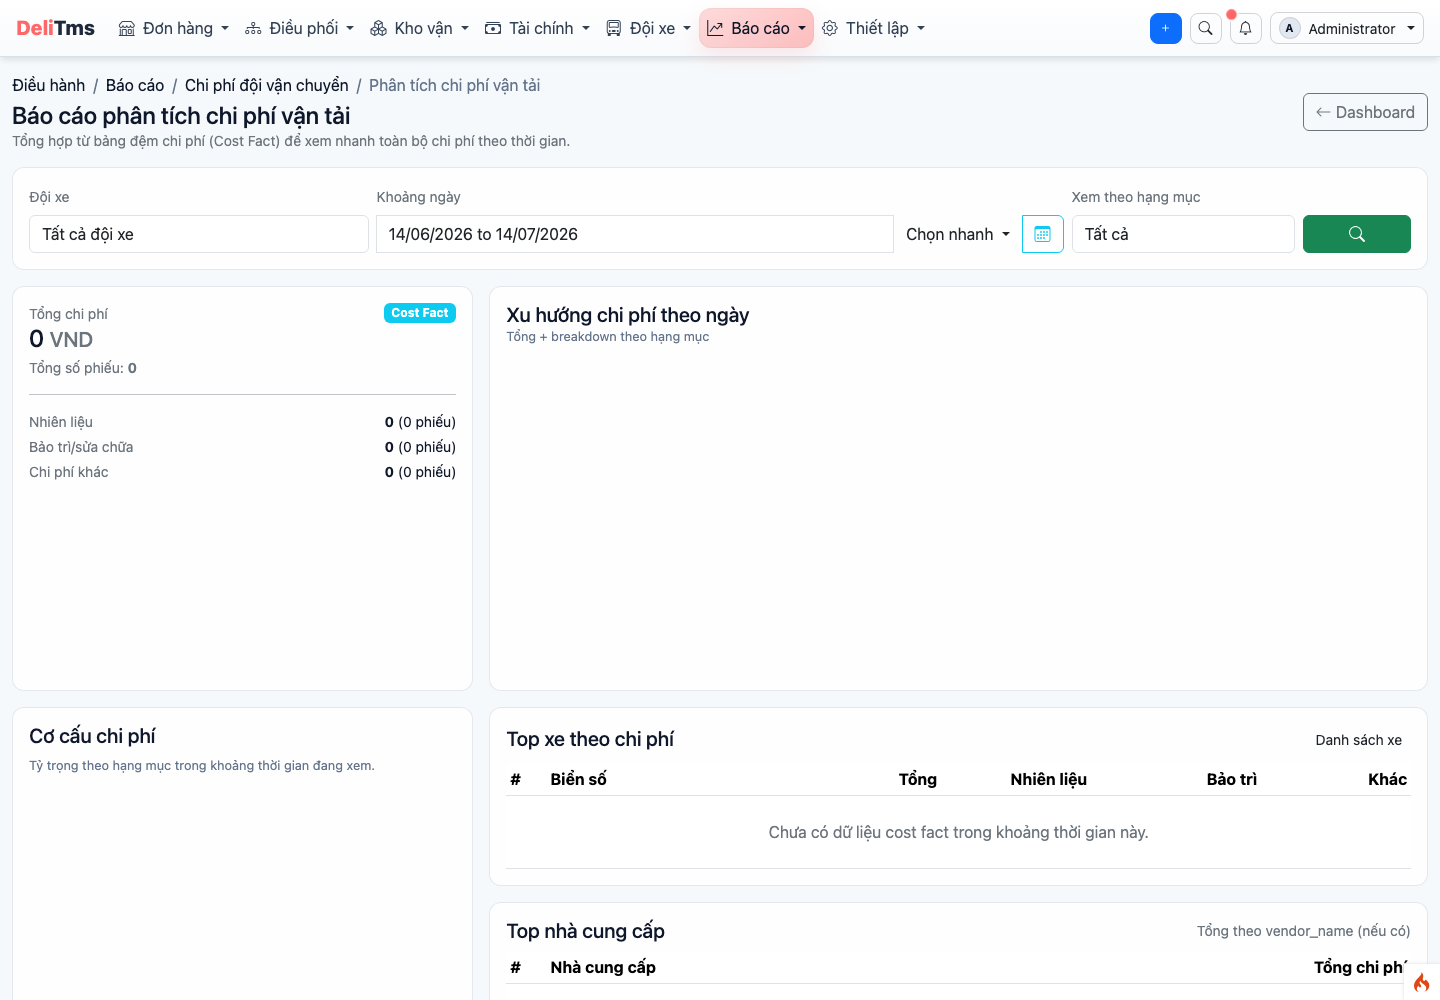
Transportation Cost Analysis — total cost per vehicle and per km.
4. KPIs and Trends
Efficiency Metrics (/report/efficiency): operational KPIs by period — completion rate, trips per vehicle, alerts per 100 trips, and daily fleet costs (fuel, repair & maintenance, other costs — same cost ledger source as Cost Analysis report) normalized to cost per completed trip. This comprehensive fleet cost analysis helps evaluate overall performance. Long-term Trends (/report/trends): multi-period trends to see direction rather than point values.
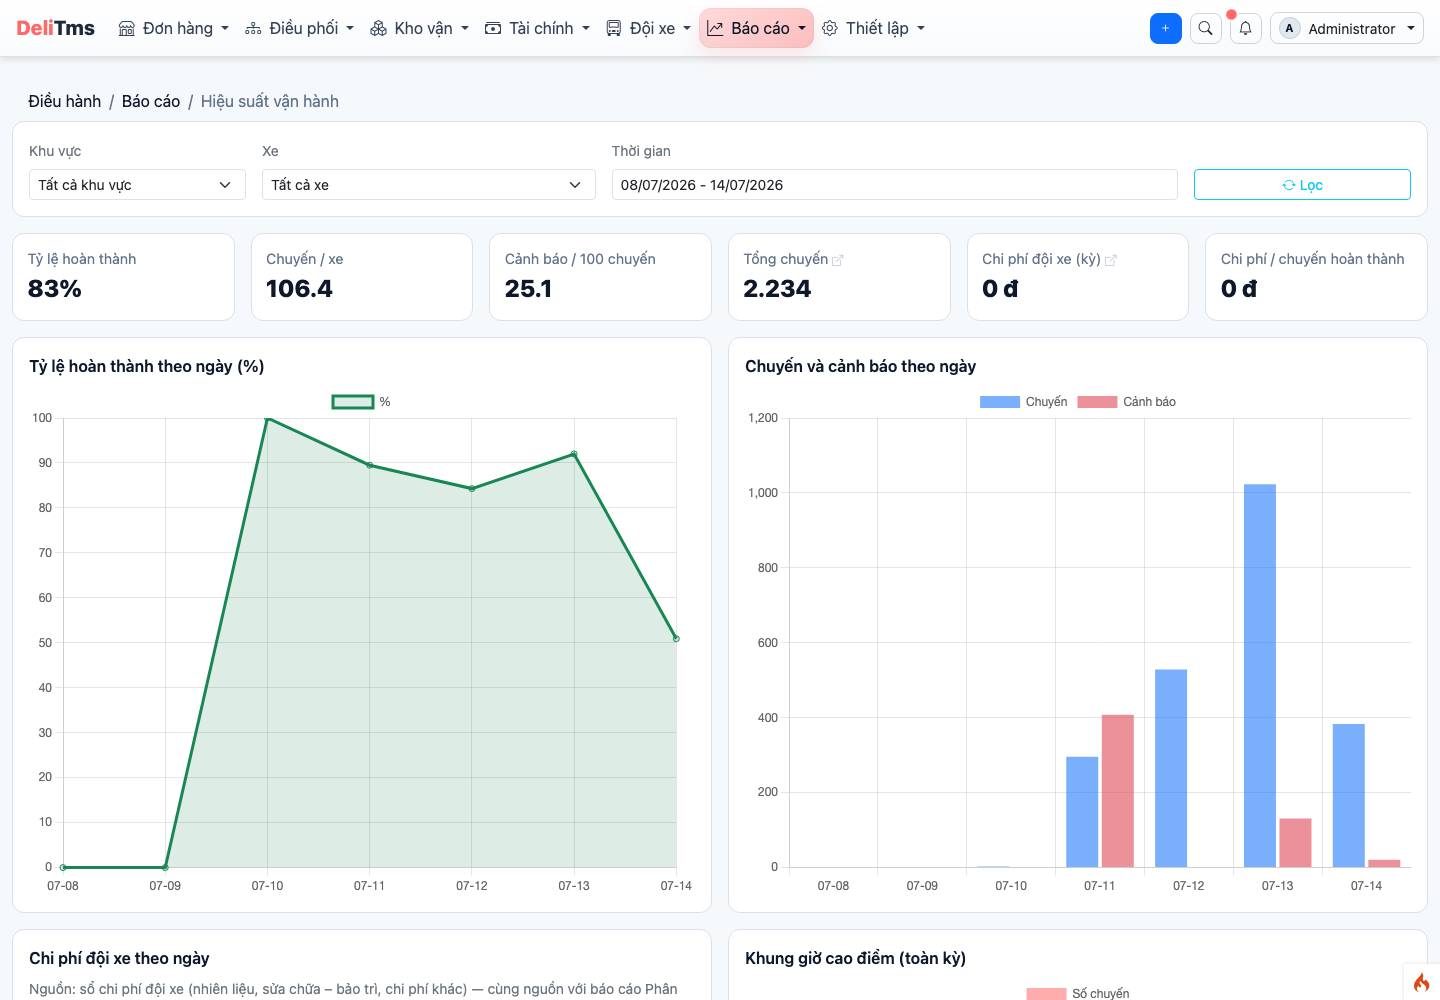
Efficiency Metrics (KPI) — operational overview by period.
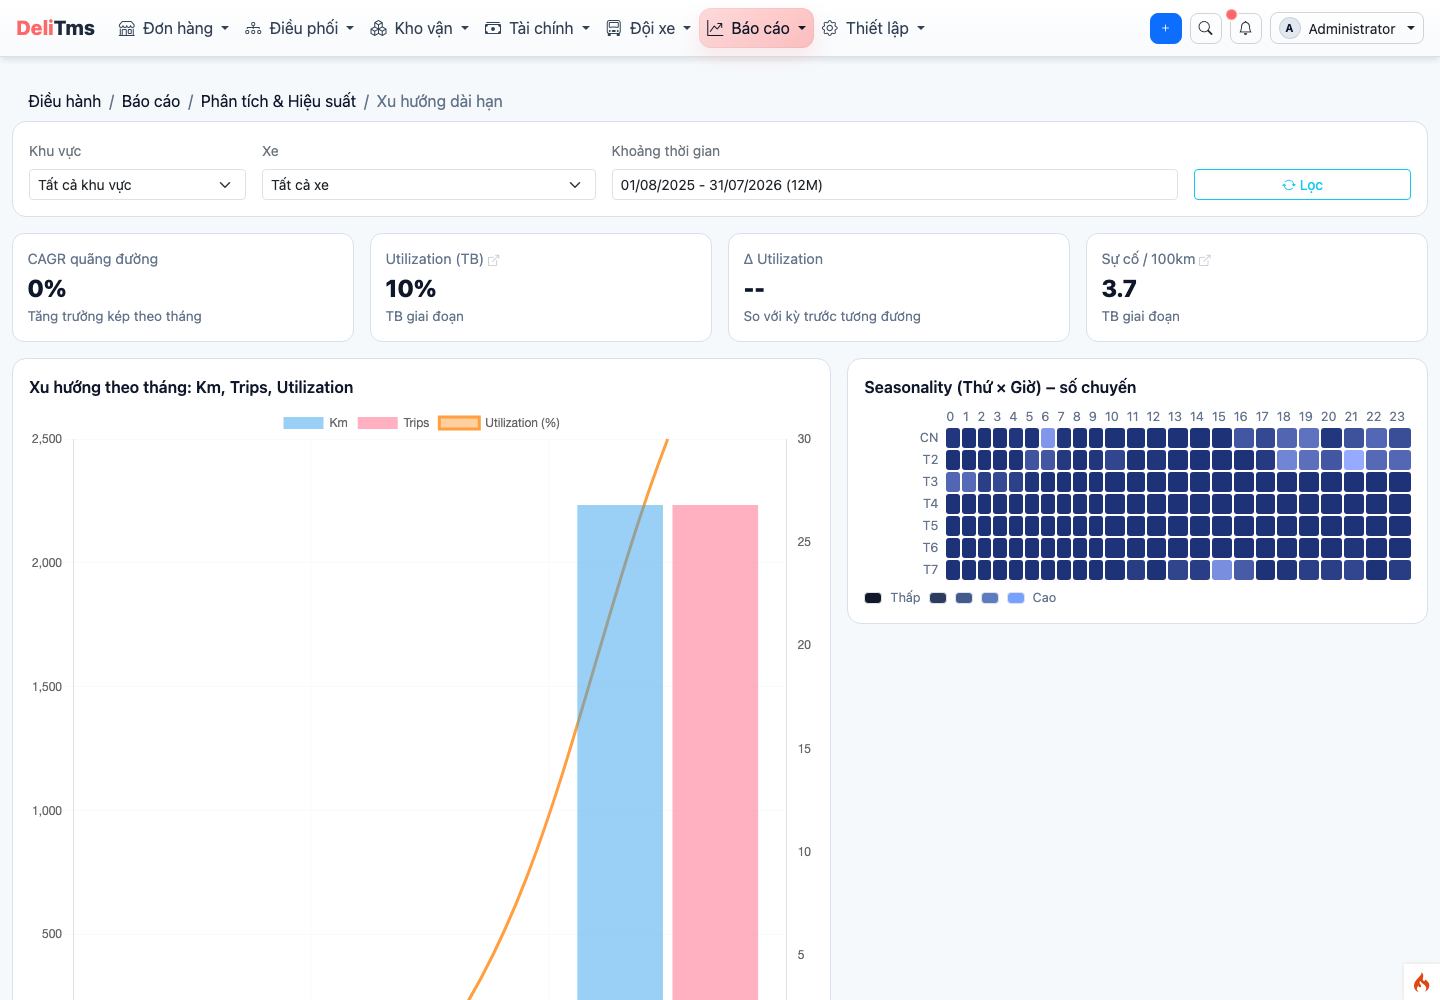
Long-term Trends — evolution of metrics across multiple periods.